Shawanaga First Nation belongs to the larger Anishnabek Nation which stretches
across much of Ontario, east across the Prairies and around the northern shores of
all the Great Lakes. The Anishnabek Nation is comprised of Algonquin, Saulteaux,
Anishnabe (Ojibway), Odawa, Chippewa and several other groups.

Population
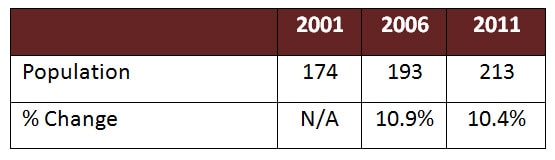
It must be noted that this number reflects all individuals residing in the census subdivision called Shawanaga 17. This will include any Shawanaga members as well as non members, plus those living on reserve and off reserve.
Over the past 10 years, the population has increased by a total of 21.3%. By comparison, the Canadian population has increased by a total of 11.3% over the past 10 years. Ontario increased by 12.3%.
According to the membership department, Shawanaga First Nation has 608 community members; 188 reside on-reserve and 420 reside off-reserve.
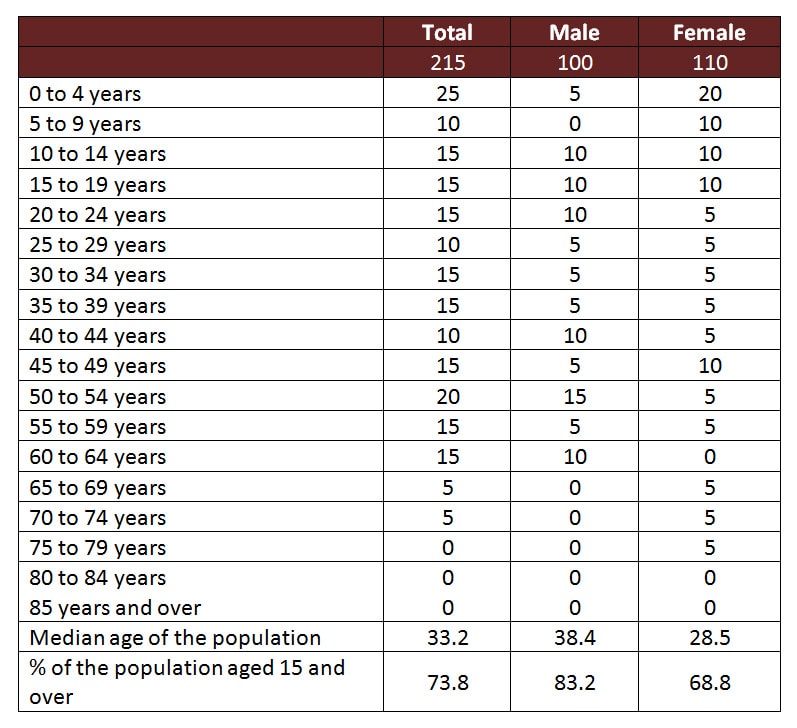
Age Characteristics (from Shawanaga 17 IR)
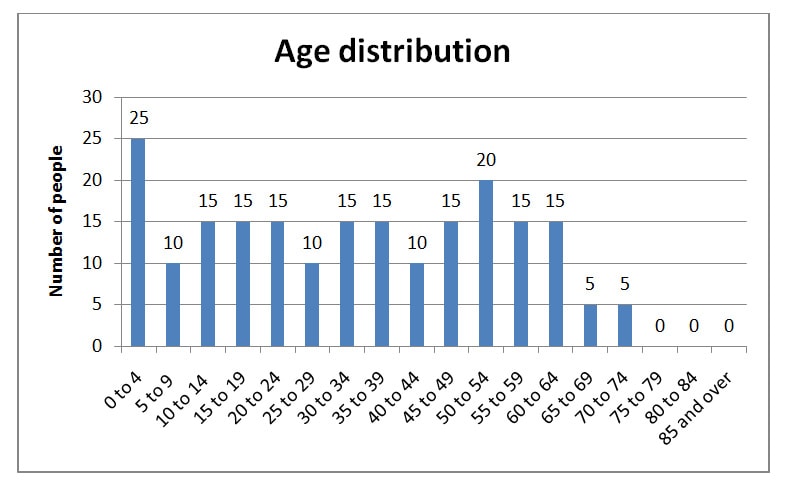
The chart below shows the age distribution among individuals living within the Shawanaga 17 census sub division region, presented in the map above (#1). Information in the chart below is aggregated so as to not potentially identify specific individuals within the community through the census information presented.
Based on the information shown, children between the age of 0 – 4 make up the highest percentage of the population and there are no members within the community over the age of 75. The median age of the Shawanaga population is 33.2 years old. Nearly three quarters of the population is over the age of 15. The male population makes up a considerable amount of those who are over the age of 15. By comparison, the median age of males is over 38 years and for females it is 28.5. The ratio of the female to male population is nearly 50/50.
Statistics for the Canadian and Ontario age distribution, during the same time period, do not show the same picture. For Ontario, the median age was 40.4 years old. The female average age was nearly 13 years older than the female age in Shawanaga. Canada was very similar to the Ontario median age distribution.
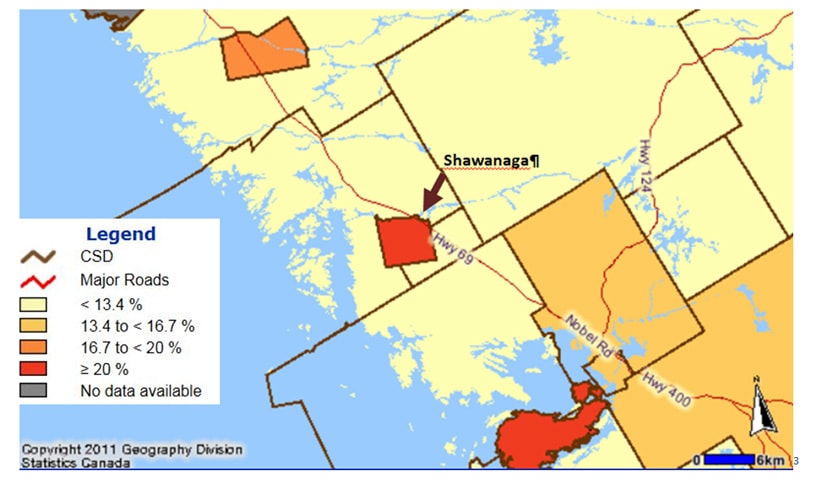
The image above shows the percentage of the population in the region/area under the age of 15. It is worth noting that in the surrounding area there is a lower density of children between the ages of 0 – 14.
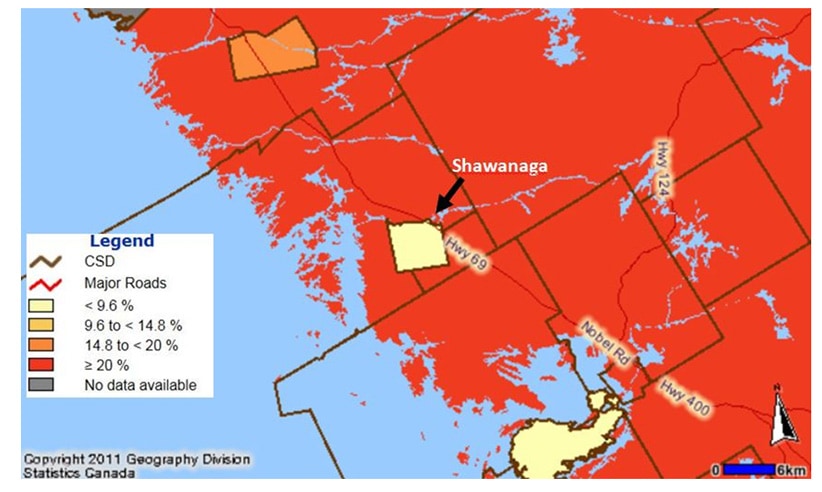
The image below shows the percentage of the population in the region/area over the age of 65. As you can see, Shawanaga is one of the few communities/areas that is below 10%. The remainder is over 20%. These statistics are consistent with First Nation statistics nationally that indicate First Nations have the youngest demographic in Canada.
Marital Status (From Shawanaga 17 IR)
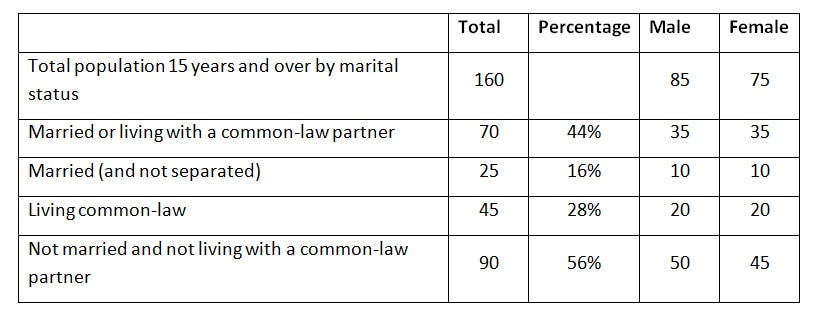
The chart below enumerates individuals who are 15 years of age or older and living within the Shawanaga Census Subdivision catchment area. The chart shows that 44% of those individuals over the age of 15 are married, the majority being common-law. The remaining 56% are not married. That includes people who are single, separated, divorced or widowed.
In Ontario and Canada, 58% of the population who are 15 years or older is married.
Family Characteristics (From Shawanaga 17 IR)
The 2011 Census indicates there is a total of 60 private households within the Shawanaga Census Subdivision. Information shows that half (50%) of those households are two-person families. A quarter of them are 3-person families. Seventeen per cent of the households are four-person families and the remaining 8% are family households that are 5 people or more. There are 40 people who are not in a census family.
There are a total of 30 lone parent families within the Shawanaga subdivision. Twenty of them are headed by a female parent and the remaining are headed by a male parent. The average number of children per census family is 1.3, which is not much higher than the 1.1 for Ontario and Canada.
Household Dwelling Characteristics
According to Statistics Canada, there are 90 dwellings in Shawanaga; more than 90% of them are single-detached homes, along with some apartment buildings, row houses and other types of homes.
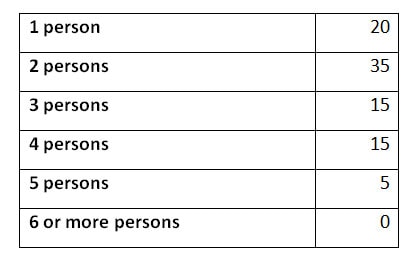
The average number of persons in a private household is 2.4. A breakdown of the household size is listed below.
Detailed Mother Tongue (from Shawanaga 17 IR)
Based on the aggregated data, 81.4% (175 people) of Shawanaga residents indicated that their mother tongue was English. The remaining residents indicated that their mother tongue was a “selected Aboriginal language” of which all chose that they spoke Ojibway. The same number said they used this language regularly at home. A very small number (2.3%) of residents indicated that they were official language minority speakers, which means they speak a language other than English or French as their primary language, likely Ojibway.
When detailing the language spoken most often at home, almost all residents spoke English most often at home. The remaining residents (4.8%) spoke Ojibway most often in their homes.